The Bridge Engineering Section of the Oregon Department of Transportation (ODOT) previously developed a structural health monitoring program to facilitate the maintenance and performance monitoring of selected highway bridges. This case study highlights three of those bridge projects in which ODOT contracted with Engineered Monitoring Solutions (EMS) to design and install the monitoring systems.
Interstate 5 Bridge
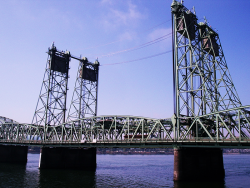 ODOT wanted to improve its monitoring of the Interstate 5 Bridge, near Portland, during the operation of its lift span. The southbound portion of the bridge conducts traffic from Washington into Oregon over the Columbia River. The steel bridge is approximately 3,500 feet long with 16 spans.
A counterweight at each end of the southbound lift span helps raise the span for ships passing underneath. When the lift span is raised, the counterweights move vertically along guide rails. ODOT’s goal was to improve its ability to monitor the lifting system’s structural performance.
EMS designed and installed a monitoring system that includes a network of CR1000 dataloggers, tiltmeters, and laser position sensors to monitor the lift span and the counterweights’ positions relative to the guide rails. The dataloggers are positioned on the counterweight blocks, on the lift span, and in the operator’s control house. Because ac power is not available when the blocks are lowered during a lift event, the dataloggers on the blocks are solar powered.
The dataloggers collect sensor data once every five seconds during a bridge opening event, as well as once every four hours to identify any historical movement trends. The networked Campbell Scientific dataloggers communicate across the system using RF401 spread-spectrum radios. The dataloggers calculate and transmit data to a server on the ODOT computer network running LoggerNet software. Bridge engineers access and evaluate lift event data related to the lift span and counterweights, enabling them to make quick decisions regarding the need for maintenance.
Fremont Bridge
 With this project, ODOT wanted to improve their understanding of the fatigue cracking of the Fremont Bridge in Portland, evidenced by the thermal strain on the tie girders. This steel-tied arch bridge spans approximately 2,150 feet and has the longest main span (1,255 feet) of any bridge in Oregon.
EMS designed and installed a monitoring system of eight CR800 dataloggers and a variety of sensors (including 64 sensors measuring strain and surface temperature) along the tie girders on both sides of the bridge. This system monitors the stress cycles in the tie girders due to thermal loading.
The networked Campbell Scientific dataloggers performed calculations on the collected data and communicated with the system via an RF450 radio network. Using an onsite CR1000 datalogger as a gateway, the tie girder data was relayed hourly to ODOT’s computer network for review by bridge engineering personnel, who could then prioritize their retrofitting efforts.
Kamal’s Bridge
 Kamal’s Bridge in Tualatin is a steel box-girder bridge with four spans crossing Interstate 5. ODOT sought to improve the monitoring of the bridge’s structural response to changes in temperature and traffic load. This was needed because fatigue cracking appeared between the transverse cross beams and the longitudinal box girders on either side of the bridge deck.
The monitoring system designed and installed by EMS collected data regarding the strain in the box-girder and cross-beam diaphragms, as well as the rotation between them. In addition, the surface temperature of the box girders and the air temperature were monitored.
Campbell Scientific’s CR9000X datalogger collected sensor data at two frequencies. Lower-frequency data was used to record the effect of temperature changes on the bridge’s performance. The datalogger recorded higher-frequency data (100 times per second) in response to short-term, live-load effects based on predetermined event criteria, whereby a larger traffic load caused one or more of the strain gages to exceed its strain threshold.
The bridge’s temperature and traffic load data was uploaded hourly from the datalogger to ODOT’s computer network to help bridge engineers assess the effectiveness of structural retrofits.